-
 Shawn
13.5kI don't understand the recent shift to the right of the political spectrum. Most if not all the economic policies of Reagan and Thatcher of an unbridled and self-regulating economy have failed as shown in the 2008 financial meltdown.
And besides the laconic and simple explanation offered by many is that we never really had a real capitalist system in place. Yet, this is also an impractical and idealistic conception of the world that will never be achievable due to the already skewed distribution of wealth.
Thinking about the future, there is a real threat of AI coming down from the heavens and literally taking away millions of jobs.
Isn't it time to try something new/different than letting the invisible hand do its work at the expense of potentially millions of jobs via automation/globalism/AI? -
 Shawn
13.5k
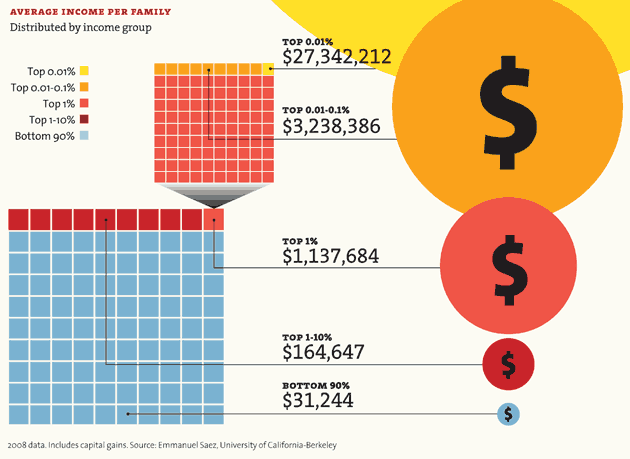
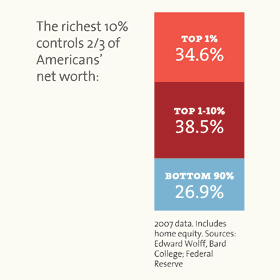
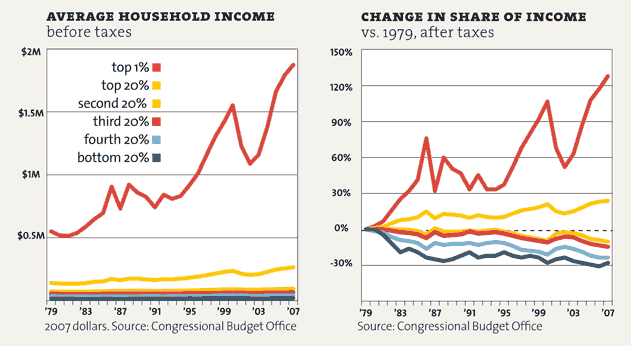
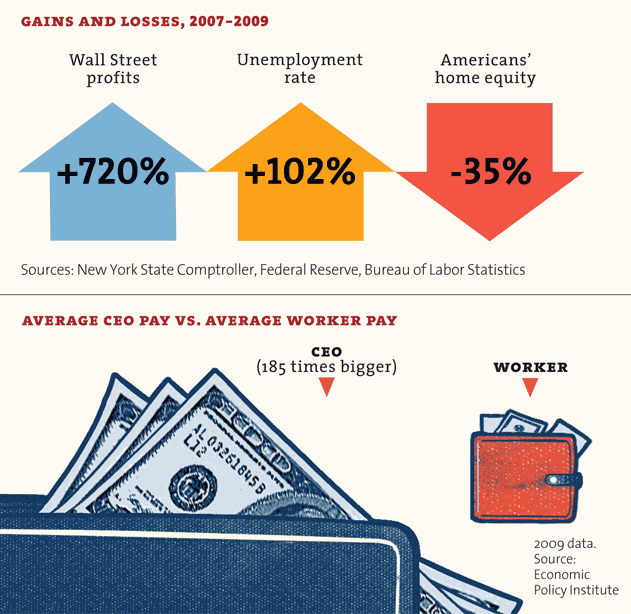
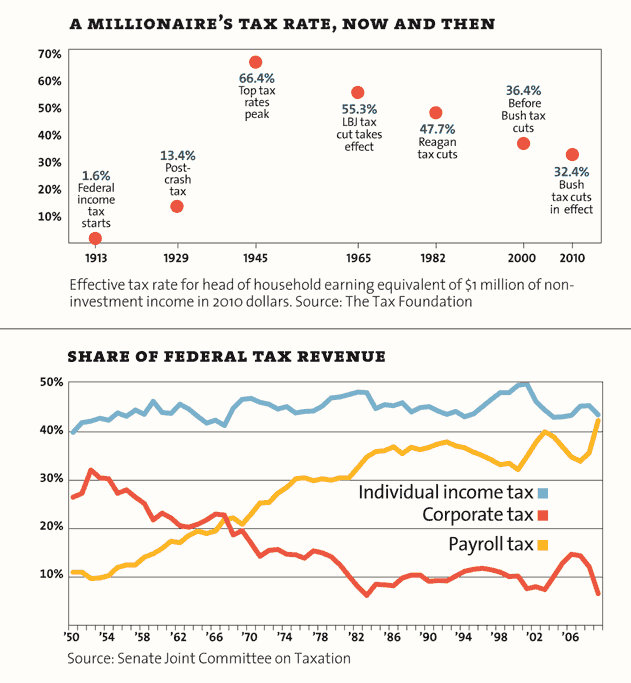
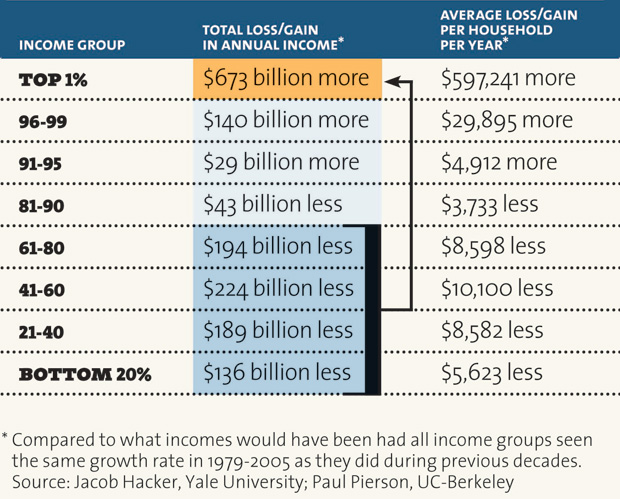
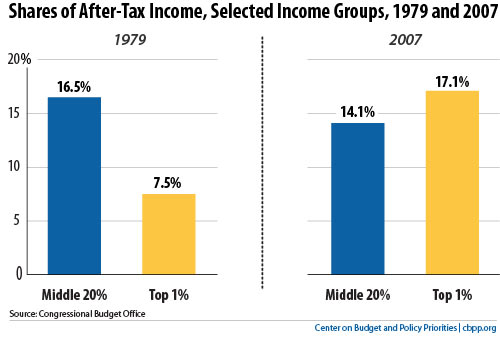
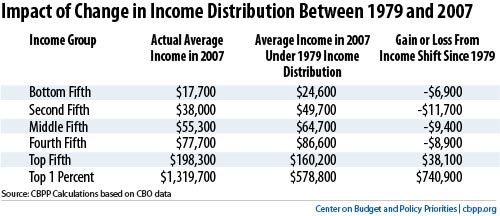
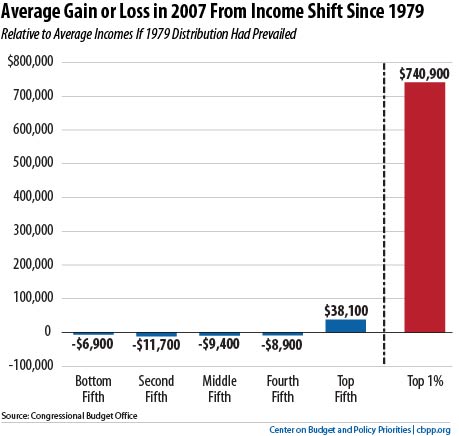
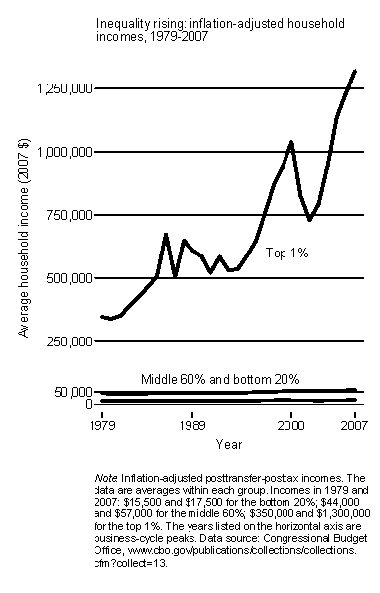
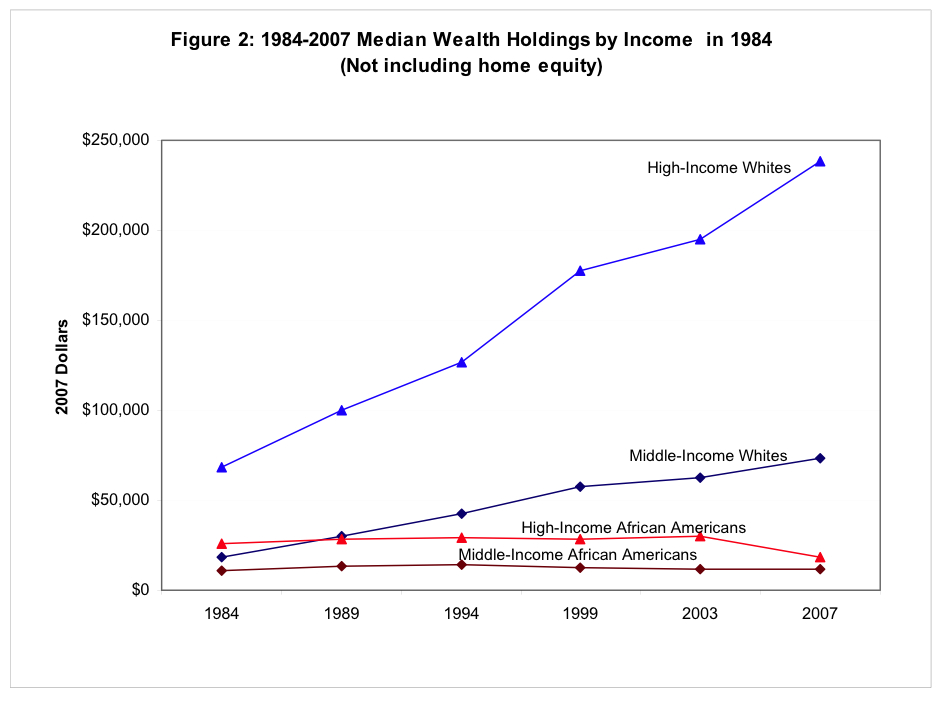
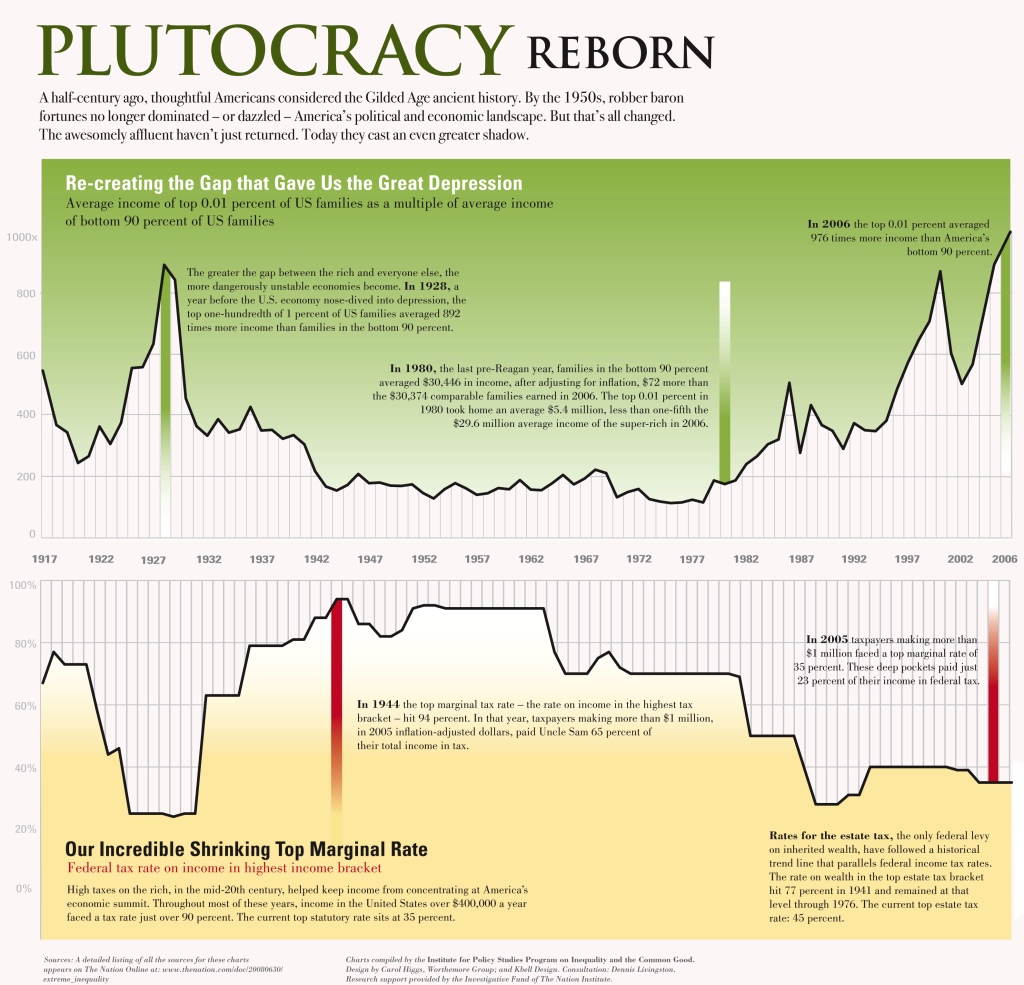
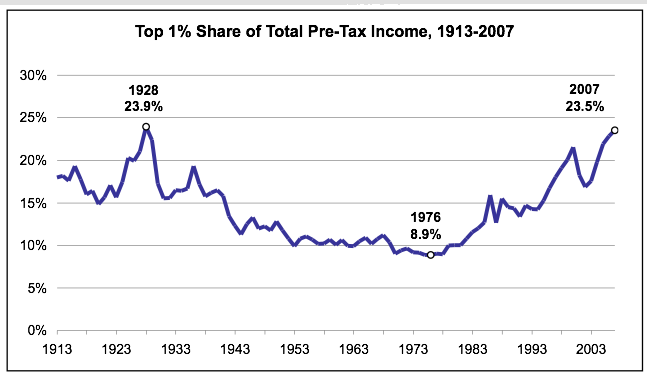
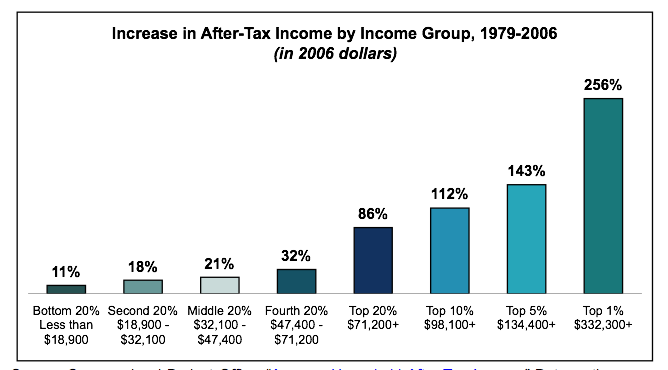
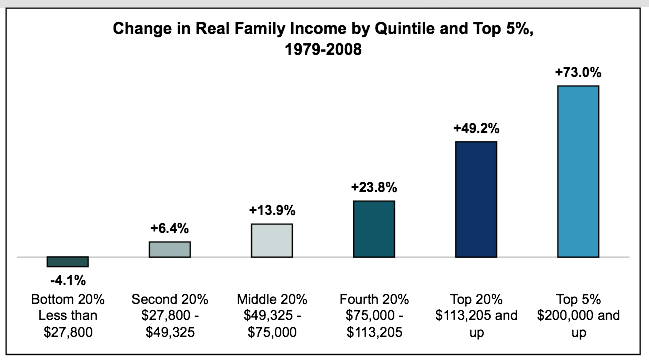
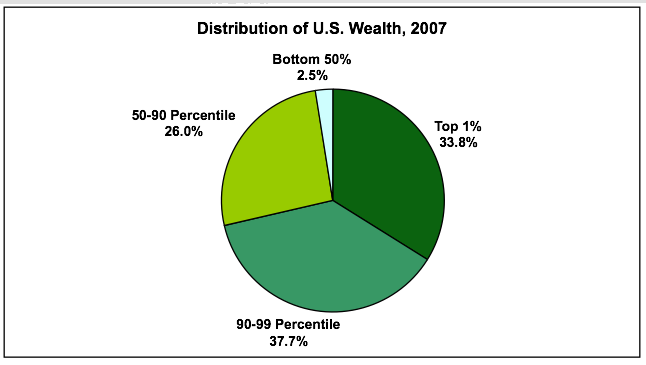
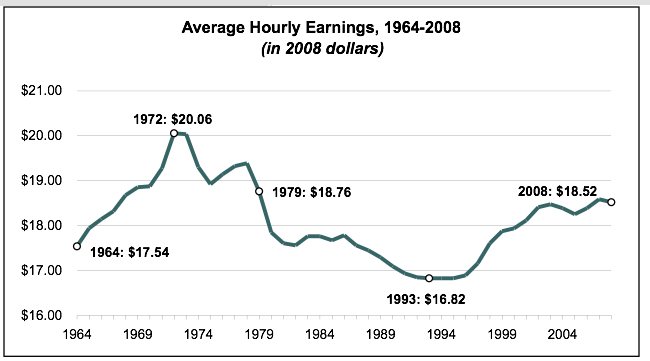
Income for the middle class has stagnated since the 70's, while the top 1 tenth of 1 percent has done phenomenally well. I don't think that is a bad illustration of whom such policies "work for" and for whom it does not. -
 Agustino
11.2k
The thing is this whole idea of "middle class" politics is fucked up. We shouldn't measure well-being by the middle class. Rather it's about whether you can move upwards if you work for it and really want it. If you don't work for it, then you shouldn't move up. If you work but you don't use your brain, you shouldn't move up either. -
 wuliheron
440Its empire baby, and this train ain't stopping until she derails. The latest emperor is a huge fan of professional wrestling and a reality TV star in his own rite. According to the National Science Foundation one in five Americans insists the sun revolves around the earth. The rest seem to be in denial that they have mob rule and are simply going on inertia and are desperate enough to vote for anyone who promises them real change from corrupt politics as usual despite the fact their candidates have been promising that for the last century.
Note that both presidential candidates would have already been put in jail if they were mere peasants like you and me. Running around groping women and sending classified emails by the tens of thousands over an unsecured server would land almost anyone else in jail. The bankers that caused the economic collapse by committing outright fraud never saw a day in jail. The billionaire mayor of NYC who arrested 26 reporters in one day merely got a slap on the wrist and told never to do that again, which is what they routinely do to the bankers who are still getting caught committing fraud every chance they get.
Its the best justice that money can buy which is why people are now rioting in the streets and snipping cops from rooftops. Its also why America has the lowest voter turnout in the developed world and why in ten years of asking I have yet to hear a single person tell me the simple distinction between a lynch mob and a democracy. Its gotten so wild that the comedians are now routinely complaining they have too much material to work with. -
 Shawn
13.5k
So, you're saying that the concerns of millions of Americans about the stagnating wages have nothing to do with the economic policies set forth and to a large extent continued under/after Reagan? -
 Shawn
13.5k
Here ya go:
Wage Stagnation in Nine Charts
PDF
Another study:
A Guide to Statistics on Historical Trends in Income Inequality -
 Thorongil
3.2kNo, see, I'm aware that wage stagnation has occurred, but it's not clear to me how Reagan or Thatcher are solely or even mostly to blame for it, as you and your links have not proven, despite your assertion to that effect in your original post.
Btw, EPI has a pretty clear left-leaning bias, so perhaps one thing you should stop and think about is whether you are fully informed. You asked why some people are shifting to the right. Well, maybe one reason for that is due to the echo chamber of the left, which believes the information it possesses is self-evidently factual and not open to dispute. -
 Shawn
13.5k
Well, I posted the links as per above. I'm open minded as to you explanation on the matter as to why income earnings have stagnated for the middle class and income inequality has risen. If all your arguments surmounts to is "correlation doesn't imply causation" then there's really nothing we can talk about or draw conclusions from such data. -
 Shawn
13.5k
So, maybe I was wrong about that claim.
What do you suppose are the reasons income has stagnated for the middle class, since 1980? -
 Buxtebuddha
1.7kIt's a little too far reaching in my opinion to blame only a few people and their respective governments for certain failings in the modern capitalist global economy. While I'd agree that many of the policies and budgeting practices seen under both Reagan and Thatcher were dubious, if not frankly bad, there was and is still a whole lot more going on in the economy that help craft the current state of middle class wage stagnation, just as one example.
I suppose blaming Reagan and Thatcher for everything wrong with x, y, or z in the economy is like only blaming Germany and Japan for WWI and WWII. The sooner you realize that essentially everyone has their shit sploshing into the shared, global toilet that is the world economy, the faster you'll see that cherry-picking is harder to reasonably do. So again, while indeed Reagan and Thatcher are in part to blame for x, y, or z failure in the global economy, don't be so quick to find fault in only them.
Edit: holy too many charts and graphs batman! Calm yourself, Question >:O -
 Wayfarer
26.1kYou might find this article of interest: George Monbiot on Neoliberalism – the ideology at the root of all our problems
Neoliberalism: do you know what it is?
Its anonymity is both a symptom and cause of its power. It has played a major role in a remarkable variety of crises: the financial meltdown of 2007‑8, the offshoring of wealth and power, of which the Panama Papers offer us merely a glimpse, the slow collapse of public health and education, resurgent child poverty, the epidemic of loneliness, the collapse of ecosystems, the rise of Donald Trump. But we respond to these crises as if they emerge in isolation, apparently unaware that they have all been either catalysed or exacerbated by the same coherent philosophy; a philosophy that has – or had – a name. What greater power can there be than to operate namelessly?
---
Blaming Reagan and Thatcher for everything wrong with x, y, or z in the economy is like only blaming Germany and Japan for WWI and WWII. — Heister Eggcart
But saying that everyone is responsible, is saying that no-one is. -
 Thorongil
3.2kI don't know. I don't claim to be an expert in economics and nor do I make claims I wouldn't know how to substantiate, but to honor your request, you might take a look at Thomas Sowell's perspective, who is on the right of the political spectrum, if only so that you will be more informed regarding the issue in question (as opposed to appearing blinkered when someone challenges you):
It has often been claimed that there has been very little change in the average real income of American households over a period of decades. It is an undisputed fact that the average real income–that is, money income adjusted for inflation–of American households rose by only 6 percent over the entire period form 1969 to 1996. That might well be considered to qualify as stagnation. But it is an equally undisputed fact that the average real income per person in the United States rose by 51 percent over that very same period.
How can both these statistics be true? Because the average number of individuals per household has been declining over the years. Half the households in the United States contained six or more people in 1900, as did 21 percent in 1950. But, by 1998, only ten percent of American households had that many people.
The average number of persons per household not only varies over time, it also varies from one racial or ethic group to another at a given time, and varies from one income bracket to another. As of 2007, for example, black household income was lower than Hispanic households. Similarly, Asian American household income was higher than white household income, even though white per capita income was higher than Asian American per capita income, because Asian American households average more people.
Income comparisons using household statistics are far less reliable indicators of standards of living than are individual income data because households vary in size while an individual always means one person. Studies of what people actually consume–that is, their standard of living–show substantial increases over the years, even among the poor, which is more in keeping with a 51 percent increase in real per capita income than with a 6 percent increase in real household income. But household income statistics present golden opportunities for fallacies to flourish, and those opportunities have been seized by many in the media, in politics, and in academia.
A Washington Post writer, for example, said, “the incomes of most American households have remained stubbornly flat over the past three decades,” suggesting that there had been little change in the standard of living. A New York Times writer likewise declared: “The incomes of most American households have failed to gain ground on inflation since 1973.” The head of a Washington think tank was quoted in the Christian Science Monitor as declaring: “The economy is growing without raising average living standards.” Harvard economist Benjamin M. Friedman said, “the median family’s income is falling after allowing for rising prices; only a relatively few at the top of the income scale have been enjoying any increase.”
Sometimes such conclusions arise from statistical naivete but sometimes the inconsistency with which the data are cited suggests a bias. Long-time New York Times columnist Tom Wicker, for example, used per capita income statistics when he depicted success for the Lyndon Johnson administration’s economic policies and family income statistics when he depicted failure for the policies of Ronald Reagan and George H. W. Bush. Families, like households, vary in size over time, from one group to another, and from one income bracket to another.
A rising standard of living is itself one of the factors behind reduced household size over time. As far back as 1960, a Census Bureau study noted “the increased tendency, particularly among unrelated individuals, to maintain their own homes or apartments rather than live with relatives or move into existing households as roomers, lodgers, and so forth.” Increased real income per person enables more people to live in their own separate dwelling units, instead of with parents, roommates, or strangers in a rooming house. Yet a reduction in the number of people living under the same roof as a result of increased prosperity can lead to statistics that are often cited as proof of economic stagnation. In a low-income household, increased income may either cause that household’s income to rise above the poverty level or cause overcrowding to be relieved by having some members go form their own separate households–which in turn can lead to statistics showing two households living below the poverty level, where there was only one before. Such statistics are not inaccurate but the conclusion drawn can be fallacious.
Differences in household size are very substantial from one income level to another. U.S. Census data show 39 million people living in households whose incomes are in the bottom 20 percent of household incomes and 64 million people living in households in the top 20 percent. Under these circumstances, measuring income inequality or income rises and falls households can lead to completely different results from measuring the same things with data on individuals. Comparing households of highly varying sizes can mean comparing apples to oranges. Not only do households differ greatly in the number of people per household and different income levels, the number of working people varies even more widely.
In the year 2000, the top 20 percent of households by income contained 19 million heads of households who worked, compared with fewer than 8 million heads of households who worked in the bottom 20 percent of households. These differences are even more extreme when comparing people who work full-time and year-round. There are nearly six times as many such people in the top 20 percent of households as in the bottom 20 percent. Even the top five percent by income had more heads of household who worked full-time for 50 or more weeks in a year than did the bottom twenty percent. In absolute numbers, there were 3.9 million heads of household working full-time and year-round in the top 5 percent of households and only 3.3 million working full-time and year-round in the bottom 20 percent.
There was a time when it was meaningful to speak of “the idle rich” and the “toiling poor” but that time is long past. Most households in the bottom 20 percent by income do not have any full-time, year-round worker and 56 percent of these households do not have anyone working even part-time. Some of these low-income households contain single mothers on welfare and their children. Some such households consist of retirees living on Social Security or others who are not working, or who are working sporadically or part-time, because of disabilities or for other reasons.
Household income data can therefore be very misleading, whether comparing income differences as of a given time or following changes in income over the years. For example, one study dividing the country into “five equal layers” by income reached dire conclusions about the degree of inequality between the top and bottom 20 percent of households. These equal percentages of households, however, were by no means equal percentages of people, since the poorest fifth of households contain 25 million fewer people than the fifth of households with the highest incomes. Increasing income inequality over time also becomes much less mysterious in an era when people are paid more for their work, because this means that people who don’t work as much, or at all, lose opportunities to share in this income rise. In addition to differences among income brackets in how many heads of households work. The top 20 percent of households have four times as many workers as in the bottom 20 percent, and more than five times as many full-time, year-round workers.
No doubt these differences in the number of paychecks per household have something to do with the differences in income, though such facts often get omitted from discussions of income “disparities” and “inequalities” caused by “society.” The very possibility that inequality is not caused by society but by people who contribute less than others to the economy, and are correspondingly less rewarded, is seldom mentioned, much less examined. But not only do households in the bottom 20 percent contribute less work, they contribute far less skills, based on education. While nearly 60 percent of Americans in the top 20 percent graduated from college, only 6 percent of those in the bottom 20 percent did so. Such glaring facts are often omitted from discussions which center on the presumed failings of “society” and resolutely ignore facts counter to that vision.
Most statistics on income inequality are very misleading in yet another way. These statistics almost invariably leave out money received as transfers from the government in various programs for low-income people which provide benefits of substantial value for which the recipients pay nothing. Since people in the bottom 20 percent of income recipients receive more than two-thirds of their income from transfer payments, leaving those cash payments out of the statistics greatly exaggerates their poverty–and leaving out in-kind transfers as well, such as subsidized housing, distorts their economic situation even more. In 2001, for example, cash and in-kind payments together accounted for 77.8 percent of the economic resources of people in the bottom 20 percent. In other words, the alarming statistics on their incomes so often cited in the media and by politicians count only 22 percent of the actual economic resources at their disposal.
Given such disparities between the economic reality and the alarming statistics, it is much easier to understand such apparent anomalies as the fact that Americans living below the official poverty level spend far more money than their incomes–as their income is defined in statistical studies. As for stagnation, by 2001 most people defined as poor had possessions once considered part of a middle class lifestyle. Three-quarters of them had air conditioning, which only a third of all Americans had in 1971. Ninety-seven percent had color television, which less than half of all Americans had in 1971. Seventy-three percent owned a microwave, which less than one percent of Americans owned in 1971, and 98 percent of “the poor” had either a videocassette recorder or a DVD player, which no one had in 1971. In addition, 72 percent of “the poor” owned a car or truck. Yet the rhetoric of the “haves” and the “have nots” continues, even in a society where it might be more accurate to refer to the “haves” and the “have lots.”
No doubt there are still some genuinely poor people who are genuinely hurting. But they bear little resemblance to most of the millions of people in the often-cited statistics on households in the bottom 20 percent. Much poverty is imported across the southern border of the United States that immigrants cross, legally or illegally, from Mexico. The poverty rate among foreign nationals in the United States is nearly double the national average. Homeless people, some disabled by drugs or mental problems, are another source of many people living in poverty. However, the image of “the working poor” who are “falling behind” as a result of society’s “inequities” bears little resemblance to the situation of most of the people earning the lowest 20 percent of income in the United States. Despite a New York Times columnist’s depiction of people who are “working hard and staying poor” in 2007, Census data from the same year showed the poverty rate among full-time, year-round workers to be 2.5 percent. -
 Buxtebuddha
1.7kWhat do you suppose are the reasons income has stagnated for the middle class, since 1980? — Question
Not every middle class job economy can grow net income at a constant or consistent rate. It used to be that the middle class had very little income disparity within its spectrum, which made income data read more positively. This, however, has deteriorated as a direct result of the more globalized economy, which has seen the rise of lower middle class and upper middle class identifications, based on income, become more prevalent and more divisive in the understanding of income numbers.
Just to tie in the past US election cycle, one of the big platforms for both major parties, as it always is, centered around the idea of strengthening and growing the middle class. This campaign lingo is a little misleading, because while the middle middle class is smaller than it used to be, the other ends of the middle class income spectrum, at least in the US, have become more prone to fluctuating - and usually in downward tendencies. The real dilemma with the middle class is not that wages are stagnant in some kind of average across the board, but that the lower middle class is much bigger than the middle middle and upper middle class income earners. This is one reason why the issue of poverty is so worrisome, especially in the 21st century, because the lower middle class has had the double tendency of both rapidly growing while also losing households to resting below the poverty line.
It must also be said that the upper middle class has seen healthy income growth the last decades overall, which is one reason why the middle class income spectrum comes out looking flat, because the lower middle class incomes get carried by those in the upper end. -
 Shawn
13.5kGiven such disparities between the economic reality and the alarming statistics, it is much easier to understand such apparent anomalies as the fact that Americans living below the official poverty level spend far more money than their incomes–as their income is defined in statistical studies. As for stagnation, by 2001 most people defined as poor had possessions once considered part of a middle class lifestyle. Three-quarters of them had air conditioning, which only a third of all Americans had in 1971. Ninety-seven percent had color television, which less than half of all Americans had in 1971. Seventy-three percent owned a microwave, which less than one percent of Americans owned in 1971, and 98 percent of “the poor” had either a videocassette recorder or a DVD player, which no one had in 1971. In addition, 72 percent of “the poor” owned a car or truck. Yet the rhetoric of the “haves” and the “have nots” continues, even in a society where it might be more accurate to refer to the “haves” and the “have lots.”
Yes, these are all nice things that one can now afford due to technology and deflationary tendencies that technology and global trade incur.
However, the point still stands that people have less in purchasing power than they did at the time for basic goods due to inflation and goods not included in the basket that are invariably affected by inflation. It's nice having TV's and air conditioning; but, what about wanting to move up the socioeconomic ladder instead? -
 Thorongil
3.2kWhat about it? I don't find that people are greatly prevented from doing so. The US allows for a high degree of upward mobility that's on par with other developed nations around the world. Secondly, not everyone wants to move up the socioeconomic ladder. Some people, including some poor people, will refuse to do so even if granted every opportunity to do so. Willful ignorance and apathy are not to be underestimated. Other people, such as myself, don't desire great wealth. Thirdly, if you care about people moving up the ladder, then the only method that's consistently been proven to work throughout history is the free market, or the "invisible hand," as you put it, while clearly using that phrase mockingly. Higher degrees and amounts of government planning and regulations, as I am going to assume you are in favor of, have been colossal failures, as the 20th century showed in abundance and places like Venezuela show today.
 -
Cavacava
2.4k
I don't understand the recent shift to the right of the political spectrum.
I guess I must have missed it. Clinton won the popular vote by around 2 million votes.
I don't think Reagan's policies had much of an effect on the US's standard of living with his voodoo economics, except that he expanded the national debt plenty.
Sowell cherry picks his facts...he left out the whole bit about how many more wife's had to go to work to prop up the standard of living between 1969 and 1996 as follows: Wives working year-round full time rose from 17% to 39% of households, and in households with children from 42% to 60% of households...so yea real household income rose because wives left the home and went to work, to buy that color TV (Census Bureau)
Interesting comment from Reagan in stump speech Reagan made in Alabama 1980. He relates his experience as the governor of California rebutting the idea that people on welfare are lazy and don’t want to work.
“I don’t believe stereotype after what we did, of people in need who are there simply because they prefer to be there. We found the overwhelming majority would like nothing better than to be out, with jobs for the future, and out here in the society with the rest of us. The trouble is, again, that bureaucracy has them so economically trapped that there is no way they can get away. And they’re trapped because that bureaucracy needs them as a clientele to preserve the jobs of the bureaucrats themselves.
I've no clue regarding the UK. -
 Shawn
13.5k
Well for starters people can't afford their mortgage despite enjoying tvs and air conditioning.
Also, moving up the ladder isn't good just for the individual; but, rather for society as a whole.
I meant to use the "invisible hand" in a non-pejorative manner. The issue I have with the invisible hand is that it does not care about people or individuals. For the matter, I am for eliminating welfare in its entirety and instead have a basic income for everyone. Sowell is one of my favorite authors for his common sense approach to economics; but, I do not think leaving the invisible hand to do its 'work' is safe or rational. -
 Thorongil
3.2kWell for starters people can't afford their mortgage — Question
Then they shouldn't have gotten one to begin with. That's an easy one. The government also shouldn't be forcing certain banks to offer risky loans to under-qualified people, which was the primary catalyst for the housing bubble and subsequent crash.
I do not think leaving the invisible hand to do its 'work' is safe or rational. — Question
History refutes your feelings here. -
 Shawn
13.5kThen they shouldn't have gotten one to begin with. That's an easy one. — Thorongil
So, in reality, people are even poorer than expected or rather have become much poorer relative to where they stood some 30 years ago. Add some inflation over those 30 years and you have a serious dilemma for some homeowners.
Depends on your interpretation of history. For the matter, since you seem to think this is either capitalism or socialism, I don't think they are mutually exclusive. I would think even the most radical libertarian would have some elements of welfare, if not for moral reasons then out of pure economics of poverty being a major drag on any society.History refutes your feelings here. — Thorongil -
 Thorongil
3.2kSo, in reality, people are even poorer than expected or rather have become much poorer relative to where they stood some 30 years ago. — Question
Possibly. That doesn't mean the free market is to blame, though.
I don't think they are mutually exclusive — Question
Neither do I, but since you've failed to specify any policies you think are bad as well as, for that matter, those you think are good, then I can only make assumptions about what you're trying to say. -
 BC
14.2kThinking about the future, there is a real threat of AI coming down from the heavens — Question
AI, automation, and mechanization of work has already arrived (in places, certain industries, certain jobs, etc.) and does indeed pose significant challenges (aka "problems" or "trouble") for the near future.
Most if not all the economic policies of Reagan and Thatcher of an unbridled and self-regulating economy have failed as shown in the 2008 financial meltdown. — Question
I'm nor sure whether a causal link can be seen between Reagan/Thatcher and 2008. Reagan's administration was followed by 3 different presidential administrations (Bush I, Clinton, Bush II) for a total of 20 years. As much as I disliked Reagan, I'm not sure I can blame 2008 on him.
One of the trends that has aggravated the maldistribution of wealth and stagnant income for the majority of people is the financialization of wealth. The Robber Barons of the 19th century made a lot of their money from real industrial activity (or speculation on real industrial activity). Industrial activity generally equals jobs. Wealth tied to producing real products and services is still real, but less so than it was say 40 years ago. The huge surge in wealth for the richest 1%-5% has been largely tied to financial income (interest, dividends, trading, currency markets, etc.) rather than production.
Much less money has been plowed into technology, production advances, training, and so forth -- investment in human resources -- than was the case say 50 years ago. Money has been diverted away from production (and "jobs, jobs, jobs") and into financial investments which don't yield much, if any, employment.
The other thing that has affected the working classes is AI, automation, and mechanization. These three factors have greatly improved worker productivity, and consequently have reduced the number of workers needed in many fields.
In the short run, this means fewer jobs. In the long run, we are all dead - as John Maynard Keynes noted.
Welcome to The Philosophy Forum!
Get involved in philosophical discussions about knowledge, truth, language, consciousness, science, politics, religion, logic and mathematics, art, history, and lots more. No ads, no clutter, and very little agreement — just fascinating conversations.
Categories
- Guest category
- Phil. Writing Challenge - June 2025
- The Lounge
- General Philosophy
- Metaphysics & Epistemology
- Philosophy of Mind
- Ethics
- Political Philosophy
- Philosophy of Art
- Logic & Philosophy of Mathematics
- Philosophy of Religion
- Philosophy of Science
- Philosophy of Language
- Interesting Stuff
- Politics and Current Affairs
- Humanities and Social Sciences
- Science and Technology
- Non-English Discussion
- German Discussion
- Spanish Discussion
- Learning Centre
- Resources
- Books and Papers
- Reading groups
- Questions
- Guest Speakers
- David Pearce
- Massimo Pigliucci
- Debates
- Debate Proposals
- Debate Discussion
- Feedback
- Article submissions
- About TPF
- Help
More Discussions
- Other sites we like
- Social media
- Terms of Service
- Sign In
- Created with PlushForums
- © 2026 The Philosophy Forum


